How to choose the baseline probability that a clinical hypothesis is true
This is a supplementary post to the talk Evidence Based Fraud & The End of Statistical Significance – you may wish to start there, if you haven’t already.
There it is explained how there is a longstanding misunderstanding that 1 minus the p value tells you the probability that the evaluated hypothesis (the main alternate hypothesis) is true. This erroneous belief has lead to gross overestimation of the probability that “positive” study findings are true.
Instead, to understand the strength of evidence implied by p values, they are best conceptualised by clinicians as likelihood ratios that can convert a Pre-Test Probability (Pre-TP; aka prior probability) that a hypothesis is true into a Post-Test Probability (Post-TP; aka posterior probability), where the trial conducted is considered “the test” of the hypothesis and accuracy of this “test”. How to perform this conversion calculation is explained in this article.
However the question then remains – how does one choose a Pre-TP that the hypothesis being evaluated is true upon which we can apply Bayesian conversions to obtain Post-TP?
In the world of EBM 2.0 the choice of a specific Pre-TP is likely to be one of the most controversial aspects of trial interpretation as there is no exact science to guide us. We will need to combine evaluations of biological plausibility together with prior evidence to come up with an estimate and while attempting to keep the process as objective as possible, there will unavoidably be a substantial element of of subjectivity.
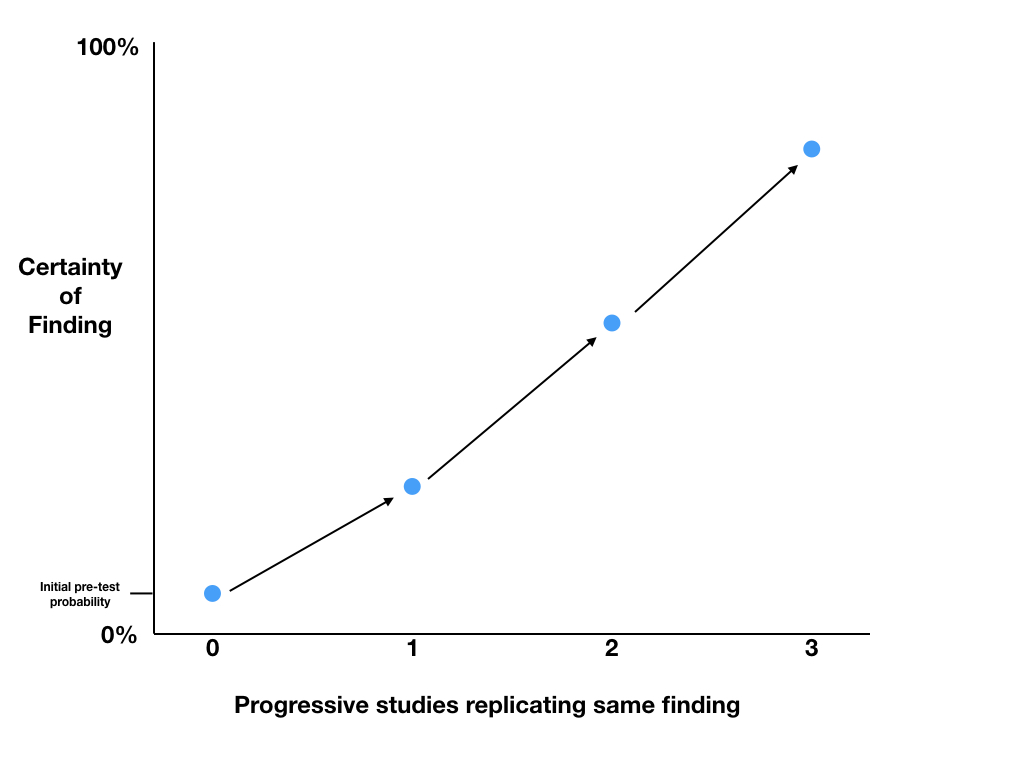
Once we have a Pre-TP estimate we can use the Bayesian methodology to calculate Post-TP which then becomes the Pre-TP for future research. So then, probably the most fundamental question is what should be our initial baseline Pre-TP for a clinical hypothesis being evaluated before we have any significant evidence to guide our estimate.
I contend that the most appropriate “starting” baseline Pre-TP for an intervention/therapy being trialled in human trials for the first time to prove efficacy (e.g. phase 2 human trials), will probably be in the range of 5-10%.
The reasons for this estimate are:
- The law of diminishing returns
- Most of the great innovations in medicine and science that were the “low hanging fruit” in terms of making large improvements in patient benefits (e.g. vaccinations, antibiotics, public health measures) occurred many decades ago. In keeping with the law of diminishing returns, with just a few exceptions, it is now increasingly difficult to develop new therapies that makes a substantial difference to mortality or other key health outcomes – benefits in absolute terms tend to be very small and there is often great controversy regarding whether the benefits are present at all (e.g. statins for primary prevention of ischaemic heart disease, thrombolysis for stroke)
- Low success rates from clinical trials
- There is evidence that the likelihood of a drug entering phase 2 trials – first (small) human trials to test efficacy – progressing to subsequent approval by regulatory authority is only approximately 16% (Hay, Nature Biotech 2014). However calculation of the likely success rates from clinical trials is fraught with problems given that the decisions to progress drugs through each phase of trials and to subsequent approval was based on flawed EBM 1.0 methodology ((see EBM 2.0 talk)) where the evaluation of “success” was grossly overestimated. Additionally as primarily industry funded trials, the level of bias (see below) within these trials is likely to be high. Consequently the real probability that these drugs were actually effective is likely to be far lower than 16%.
- Counteract bias
- Even embracing an EBM 2.0 approach, there will be many intentional and unintentional actions/decisions/eventualities in the conduct of trials that will create substantial amounts of bias. The conglomeration of factors that cause this bias is extensive and the combined force of these factors to create bias is exceedingly strong … in fact somewhat overpowering in the EBM world. This bias will not only generate inflated clinical effect sizes and misleadingly low p values but it will also affect the interpretation and conclusions based on these values. To build in an automatic counterbalance to this predictable and unavoidable effect of bias, it would be arguably prudent and wise for the EBM community to be necessarily conservative in our estimate of the baseline Pre-TP, and consider choosing 5%. That being said, if bias is being accounted for, or adjusted for, in other ways in the interpretation of evidence, then the 10% upper end of the estimate may be reasonable.
- Enforce the practice of seeking replications
- Replications are a bedrock requirement of scientific discovery and yet it has become commonplace for widespread recommendations (including in guidelines) for practice change to occur based on a single clinical study. Using Bayesian analysis based on a conservative baseline Pre-TP will almost always promote the the search for replication of findings as even with very low p values, the Post-TP will rarely be sufficiently high enough to warrant practice change.
- Optimally allocate resources:
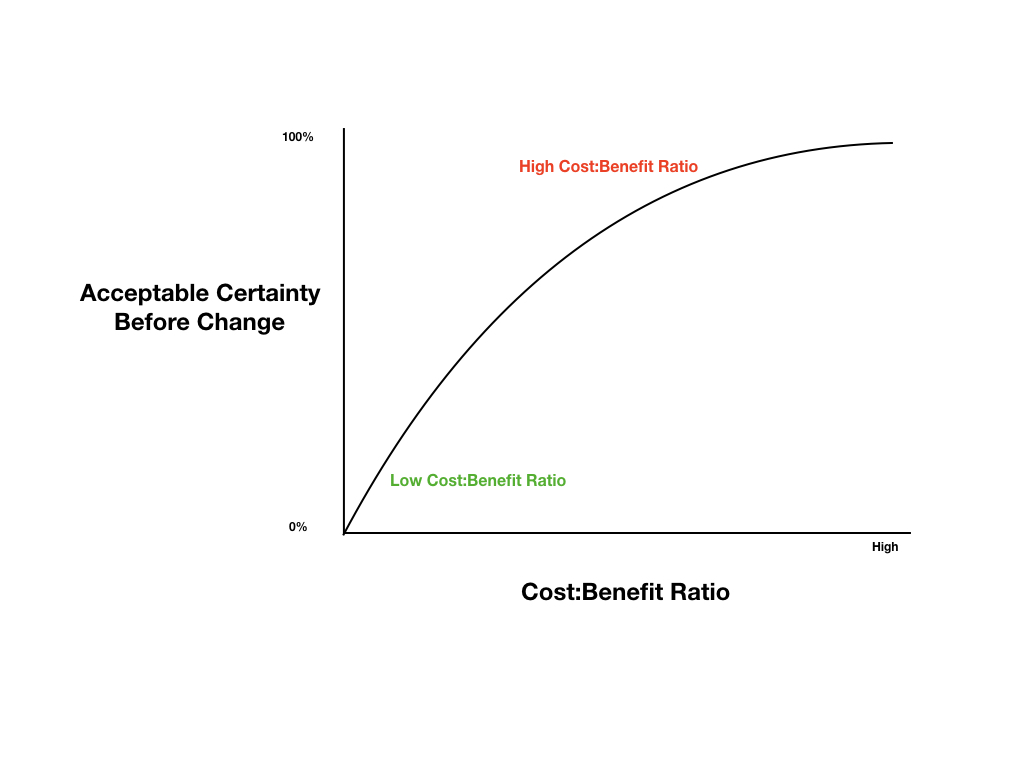
- In a world of limited resources and unlimited competing priorities, in order to optimally allocate resources to create the greatest societal and health benefits, it would be advisable to take a conservative approach to Pre-TP estimation to maximise the chance of resource allocation towards the most high value therapies and minimise the risk of resource allocation to low value (or no value) care. Starting with a conservative Pre-TP will greatly assist in this goal.
Notably a 10% Pre-TP has been suggested by other sources and utilised in other examples demonstrating the likely baseline rate of false null hypotheses in trials of new therapies (Colquhoun 2014, Spiegelhalter 2019).
The suggested baseline Pre-TP should then be adjusted based on available data. For example, a large body of observational data supporting the hypothesis might provide a good reason to elevate the Pre-TP. However, given how routine it is for observational data findings not to pan out in randomised controlled trials (RCTs), it may be prudent again to be cautiously conservative and only lift the estimated Pre-TP by small amounts.
The only data that should make substantial changes to our probability that our hypothesis is true, are high quality data such as blinded randomised controlled trials. If subsequent studies replicate the same findings, we can use the p values to calculate Post-TP and progressively increase our level of certainty in the findings. The Post-TP probability post the first trial, becomes the Pre-TP before the second trial, and so on.